 VictoriaMetrics MCP Server


The implementation of Model Context Protocol (MCP) server for VictoriaMetrics.
This provides access to your VictoriaMetrics instance and seamless integration with VictoriaMetrics APIs and documentation. It can give you a comprehensive interface for monitoring, observability, and debugging tasks related to your VictoriaMetrics instances, enable advanced automation and interaction capabilities for engineers and tools.
Features
This MCP server allows you to use almost all read-only APIs of VictoriaMetrics, i.e. all functions available in VMUI:
- Querying metrics and exploring data (even drawing graphs if your client supports it)
- Listing and exporting available metrics, labels, labels values and entire series
- Analyzing and testing your alerting and recording rules and alerts
- Showing parameters of your VictoriaMetrics instance
- Exploring cardinality of your data and metrics usage statistics
- Analyzing, tracing, prettifying and explaining your queries
- Debugging your relabeling rules, downsampling and retention policy configurations
- Integration with VictoriaMetrics Cloud
- UI with setup instrinctions and tools inspection on the root endpoint (only in Streamable HTTP mode)
In addition, the MCP server contains embedded up-to-date documentation and is able to search it without online access.
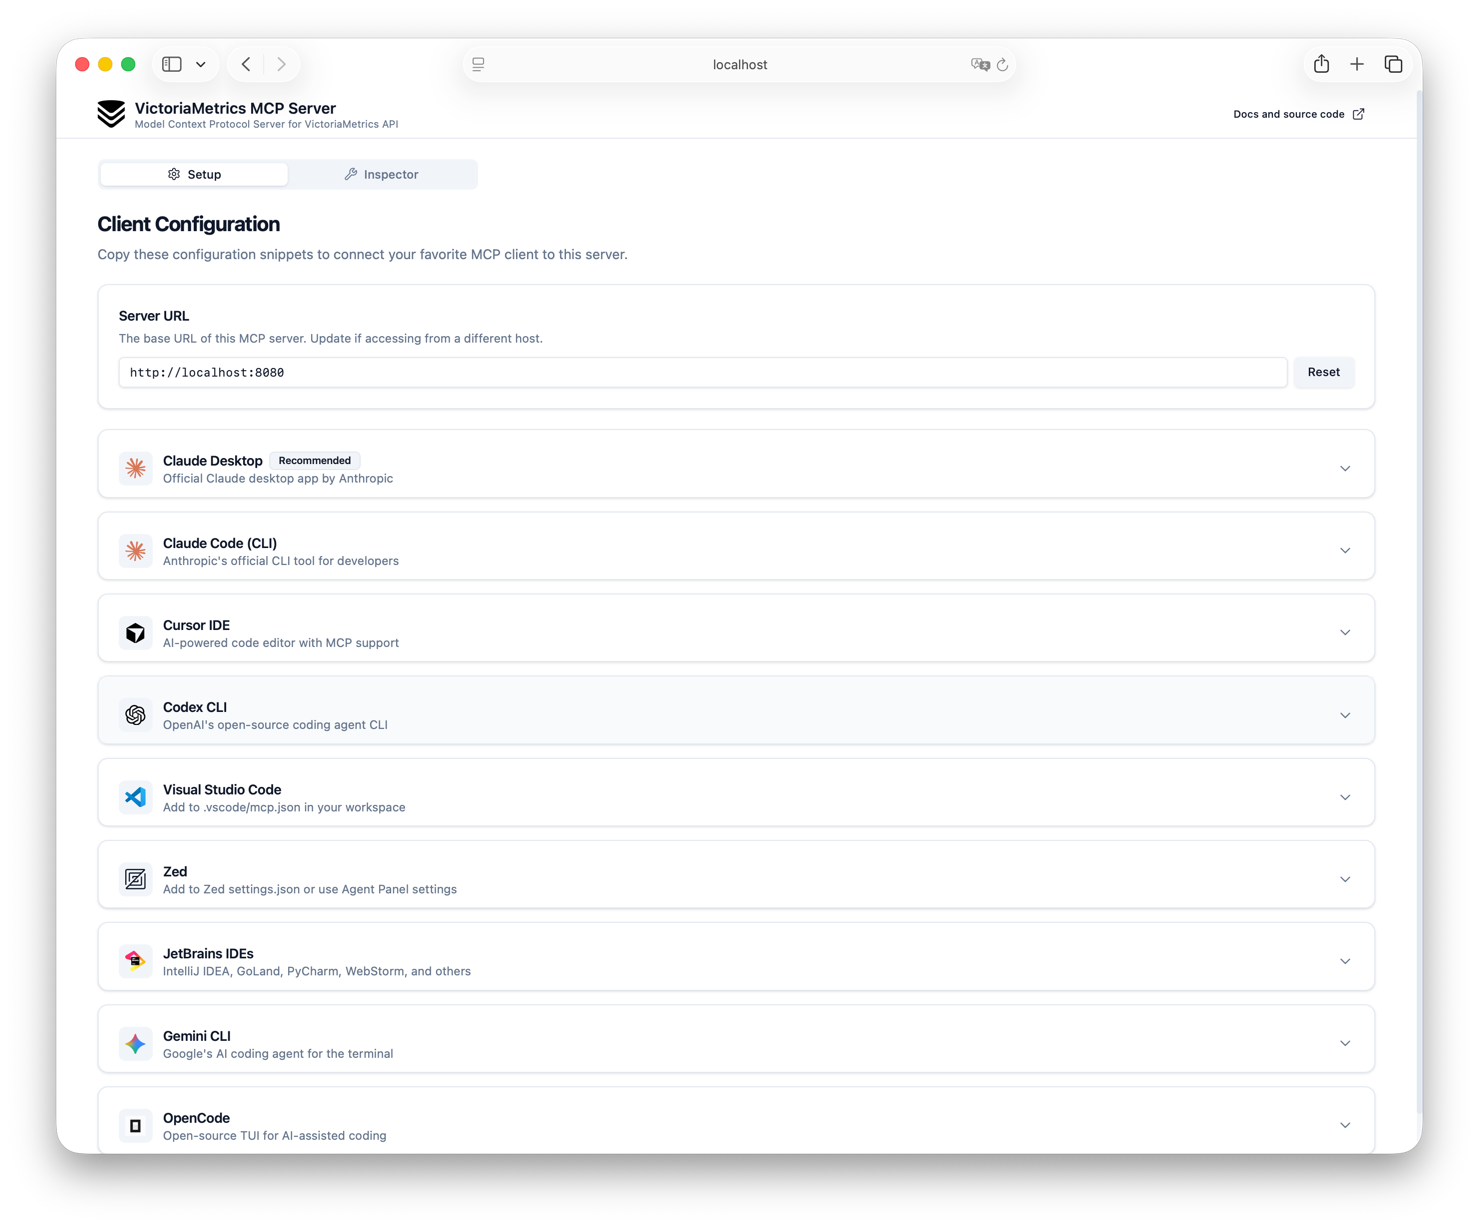
More details about the exact available tools and prompts can be found in the Usage section.
You can combine functionality of tools, docs search in your prompts and invent great usage scenarios for your VictoriaMetrics instance. Just check the Dialog example section to see how it can work. And please note the fact that the quality of the MCP Server and its responses depends very much on the capabilities of your client and the quality of the model you are using.
You can also combine the MCP server with other observability or doc search related MCP Servers and get even more powerful results.
Try without installation
There is a publicly available instance of the VictoriaMetrics MCP Server that you can use to test the features without installing it:
https://play-mcp.victoriametrics.com/mcp
Attention! This URL is not supposed to be opened in a browser, it is intended to be used in MCP clients.
It's available in Streamable HTTP mode and configured to work with Public VictoriaMetrics Playground.
Here is example of configuration for Claude Desktop:
Requirements
- VictoriaMetrics or VictoriaMetrics Cloud instance (single-node or cluster)
- Go 1.26 or higher (if you want to build from source)
Installation
Binaries
Just download the latest release from Releases page and put it to your PATH.
Example for Linux x86_64 (note that other architectures and platforms are also available):
latest=$(curl -s https://api.github.com/repos/VictoriaMetrics/mcp-victoriametrics/releases/latest | grep 'tag_name' | cut -d\" -f4)
wget https://github.com/VictoriaMetrics/mcp-victoriametrics/releases/download/$latest/mcp-victoriametrics_Linux_x86_64.tar.gz
tar axvf mcp-victoriametrics_Linux_x86_64.tar.gz
Docker
You can run VictoriaMetrics MCP Server using Docker.
This is the easiest way to get started without needing to install Go or build from source.
docker run -d --name mcp-victoriametrics \
  -e VM_INSTANCE_ENTRYPOINT=https://play.victoriametrics.com \
  -e VM_INSTANCE_TYPE=cluster \
  -e MCP_SERVER_MODE=sse \
  -e MCP_LISTEN_ADDR=:8080 \
  -p 8080:8080 \
  ghcr.io/victoriametrics/mcp-victoriametrics
You should replace environment variables with your own parameters.
Note that the MCP_SERVER_MODE=http flag is used to enable Streamable HTTP mode.
More details about server modes can be found in the Configuration section.
See available docker images in github registry.
Also see Using Docker instead of binary section for more details about using Docker with MCP server with clients in stdio mode.
Source Code
For building binary from source code you can use the following approach:
-
Clone repo:
git clone https://github.com/VictoriaMetrics/mcp-victoriametrics.git cd mcp-victoriametrics -
Build binary from cloned source code:
make build # after that you can find binary mcp-victoriametrics and copy this file to your PATH or run inplace -
Build image from cloned source code:
docker build -t mcp-victoriametrics .
# after that you can use docker image mcp-victoriametrics for running or pushing
Helm
Check out VictoriaMetrics MCP Server Helm chart documentation for more details about installation using Helm.
Configuration
MCP Server for VictoriaMetrics is configured via environment variables:
| Variable | Description | Required | Default | Allowed values |
|---|---|---|---|---|
VM_INSTANCE_ENTRYPOINT / VMC_API_KEY | URL to VictoriaMetrics instance (it should be root / URL of vmsingle or vmselect) | Yes (if you don't use VMC_API_KEY) | - | - |
VM_INSTANCE_TYPE | Type of VictoriaMetrics instance | Yes (if you don't use VMC_API_KEY) | - | single, cluster |
VM_INSTANCE_BEARER_TOKEN | Authentication token for VictoriaMetrics API | No | - | - |
VM_INSTANCE_HEADERS | Custom HTTP headers to send with requests (comma-separated key=value pairs) | No | - | - |
MCP_PASSTHROUGH_HEADERS | HTTP header names to forward from incoming MCP requests to VictoriaMetrics (comma-separated list). Overrides VM_INSTANCE_HEADERS on collision. Only applies in sse/http modes. | No | - | - |
VM_DEFAULT_TENANT_ID | Default tenant ID for cluster mode. Format: accountID or accountID:projectID (32-bit integers). See VictoriaMetrics cluster docs | No | 0 | - |
VMC_API_KEY | API key from VictoriaMetrics Cloud Console | No | - | - |
MCP_SERVER_MODE | Server operation mode. See Modes for details. | No | stdio | stdio, sse, http |
MCP_LISTEN_ADDR | Address for SSE or HTTP server to listen on | No | localhost:8080 | - |
MCP_DISABLED_TOOLS | Comma-separated list of tools to disable | No | 'export,flags,metric_relabel_debug,downsampling_filters_debug,retention_filters_debug,test_rules' | - |
MCP_DISABLE_RESOURCES | Disable all resources (documentation tool will continue to work) | No | false | false, true |
MCP_HEARTBEAT_INTERVAL | Defines the heartbeat interval for the streamable-http protocol. It means the MCP server will send a heartbeat to the client through the GET connection, to keep the connection alive from being closed by the network infrastructure (e.g. gateways) | No | 30s | - |
MCP_LOG_FORMAT | Log output format | No | text | text, json |
MCP_LOG_LEVEL | Minimum log level | No | info | debug, info, warn, error |
You can use two options to connect to your VictoriaMetrics instance:
- Using
VM_INSTANCE_ENTRYPOINT+VM_INSTANCE_TYPE+VM_INSTANCE_BEARER_TOKEN(optional) environment variables to connect to any single-node or cluster instance of VictoriaMetrics. - Using
VMC_API_KEYenvironment variable to work with your VictoriaMetrics Cloud instances.
Modes
MCP Server supports the following modes of operation (transports):
stdio- Standard input/output mode, where the server reads commands from standard input and writes responses to standard output. This is the default mode and is suitable for local servers.sse- Server-Sent Events. Server will expose the/sseand/messageendpoints for SSE connections.http- Streamable HTTP. Server will expose the/mcpendpoint for HTTP connections.
More info about traqnsports you can find in MCP docs:
Сonfiguration examples
# For a single-node instance
export VM_INSTANCE_ENTRYPOINT="http://localhost:8428"
export VM_INSTANCE_TYPE="single"
export VM_INSTANCE_BEARER_TOKEN="your-token"
export MCP_PASSTHROUGH_HEADERS="X-Token,X-Access-Key"

# For a cluster
export VM_INSTANCE_ENTRYPOINT="https://play.victoriametrics.com"
export VM_INSTANCE_TYPE="cluster"
export MCP_DISABLED_TOOLS="export,metric_statistics,test_rules" # disable export, statistics and rules unit test tools

# For VictoriaMetrics Cloud
export VMC_API_KEY="<you-api-key>"

# Server mode
export MCP_SERVER_MODE="sse"
export MCP_LISTEN_ADDR="0.0.0.0:8080"

# Custom headers for authentication (e.g., behind a reverse proxy)
# Expected syntax is key=value separated by commas
export VM_INSTANCE_HEADERS="<HEADER>=<HEADER_VALUE>,<HEADER>=<HEADER_VALUE>"
Endpoints
In SSE and HTTP modes the MCP server provides the following endpoints:
| Endpoint | Description |
|---|---|
/ | Landing page with setup help and tool inspection |
/sse + /message | Endpoints for messages in SSE mode (for MCP clients that support SSE) |
/mcp | HTTP endpoint for streaming messages in HTTP mode (for MCP clients that support Streamable HTTP) |
/metrics | Metrics in Prometheus format for monitoring the MCP server |
/health/liveness | Liveness check endpoint to ensure the server is running |
/health/readiness | Readiness check endpoint to ensure the server is ready to accept requests |
Setup in clients
Cursor
Go to: Settings -> Cursor Settings -> MCP -> Add new global MCP server and paste the following configuration into your Cursor ~/.cursor/mcp.json file:
{
  "mcpServers": {
    "victoriametrics": {
      "command": "/path/to/mcp-victoriametrics",
      "env": {
        "VM_INSTANCE_ENTRYPOINT": "<YOUR_VM_INSTANCE>",
        "VM_INSTANCE_TYPE": "<YOUR_VM_INSTANCE_TYPE>",
        "VM_INSTANCE_BEARER_TOKEN": "<YOUR_VM_BEARER_TOKEN>",
        "VM_INSTANCE_HEADERS": "<HEADER>=<HEADER_VALUE>,<HEADER>=<HEADER_VALUE>"
      }
    }
  }
}
See Cursor MCP docs for more info.
Claude Desktop
Add this to your Claude Desktop claude_desktop_config.json file (you can find it if open Settings -> Developer -> Edit config):
{
  "mcpServers": {
    "victoriametrics": {
      "command": "/path/to/mcp-victoriametrics",
      "env": {
        "VM_INSTANCE_ENTRYPOINT": "<YOUR_VM_INSTANCE>",
        "VM_INSTANCE_TYPE": "<YOUR_VM_INSTANCE_TYPE>",
        "VM_INSTANCE_BEARER_TOKEN": "<YOUR_VM_BEARER_TOKEN>",
        "VM_INSTANCE_HEADERS": "<HEADER>=<HEADER_VALUE>,<HEADER>=<HEADER_VALUE>"
      }
    }
  }
}
See Claude Desktop MCP docs for more info.
Claude Code
Run the command:
claude mcp add victoriametrics -- /path/to/mcp-victoriametrics \
  -e VM_INSTANCE_ENTRYPOINT=<YOUR_VM_INSTANCE> \
  -e VM_INSTANCE_TYPE=<YOUR_VM_INSTANCE_TYPE>
  -e VM_INSTANCE_BEARER_TOKEN=<YOUR_VM_BEARER_TOKEN>
  -e VM_INSTANCE_HEADERS="<HEADER>=<HEADER_VALUE>,<HEADER>=<HEADER_VALUE>"
See Claude Code MCP docs for more info.
Codex
Codex CLI and the IDE extension use the same MCP configuration file: ~/.codex/config.toml
(or .codex/config.toml in a trusted project).
Run the command:
codex mcp add victoriametrics \
  --env VM_INSTANCE_ENTRYPOINT=<YOUR_VM_INSTANCE> \
  --env VM_INSTANCE_TYPE=<YOUR_VM_INSTANCE_TYPE> \
  --env VM_INSTANCE_BEARER_TOKEN=<YOUR_VM_BEARER_TOKEN> \
  --env VM_INSTANCE_HEADERS="<HEADER>=<HEADER_VALUE>,<HEADER>=<HEADER_VALUE>" \
  -- /path/to/mcp-victoriametrics
Or add the following to your Codex ~/.codex/config.toml file:
[mcp_servers.victoriametrics]
command = "/path/to/mcp-victoriametrics"

[mcp_servers.victoriametrics.env]
VM_INSTANCE_ENTRYPOINT = "<YOUR_VM_INSTANCE>"
VM_INSTANCE_TYPE = "<YOUR_VM_INSTANCE_TYPE>"
VM_INSTANCE_BEARER_TOKEN = "<YOUR_VM_BEARER_TOKEN>"
VM_INSTANCE_HEADERS = "<HEADER>=<HEADER_VALUE>,<HEADER>=<HEADER_VALUE>"
If you run the server in Streamable HTTP mode, you can register it with:
codex mcp add victoriametrics --url http://localhost:8080/mcp
See Codex MCP docs for more info.
Visual Studio Code
Add this to your VS Code MCP config file:
{
  "servers": {
    "victoriametrics": {
      "type": "stdio",
      "command": "/path/to/mcp-victoriametrics",
      "env": {
        "VM_INSTANCE_ENTRYPOINT": "<YOUR_VM_INSTANCE>",
        "VM_INSTANCE_TYPE": "<YOUR_VM_INSTANCE_TYPE>",
        "VM_INSTANCE_BEARER_TOKEN": "<YOUR_VM_BEARER_TOKEN>",
        "VM_INSTANCE_HEADERS": "<HEADER>=<HEADER_VALUE>,<HEADER>=<HEADER_VALUE>"
      }
    }
  }
}
See VS Code MCP docs for more info.
Zed
Add the following to your Zed config file:
  "context_servers": {
    "victoriametrics": {
      "command": {
        "path": "/path/to/mcp-victoriametrics",
        "args": [],
        "env": {
          "VM_INSTANCE_ENTRYPOINT": "<YOUR_VM_INSTANCE>",
          "VM_INSTANCE_TYPE": "<YOUR_VM_INSTANCE_TYPE>",
          "VM_INSTANCE_BEARER_TOKEN": "<YOUR_VM_BEARER_TOKEN>",
          "VM_INSTANCE_HEADERS": "<HEADER>=<HEADER_VALUE>,<HEADER>=<HEADER_VALUE>"
        }
      },
      "settings": {}
    }
  }
See Zed MCP docs for more info.
JetBrains IDEs
- Open
Settings->Tools->AI Assistant->Model Context Protocol (MCP). - Click
Add (+) - Select
As JSON - Put the following to the input field:
{
  "mcpServers": {
    "victoriametrics": {
      "command": "/path/to/mcp-victoriametrics",
      "env": {
        "VM_INSTANCE_ENTRYPOINT": "<YOUR_VM_INSTANCE>",
        "VM_INSTANCE_TYPE": "<YOUR_VM_INSTANCE_TYPE>",
        "VM_INSTANCE_BEARER_TOKEN": "<YOUR_VM_BEARER_TOKEN>",
        "VM_INSTANCE_HEADERS": "<HEADER>=<HEADER_VALUE>,<HEADER>=<HEADER_VALUE>"
      }
    }
  }
}
Windsurf
Add the following to your Windsurf MCP config file.
{
  "mcpServers": {
    "victoriametrics": {
      "command": "/path/to/mcp-victoriametrics",
      "env": {
        "VM_INSTANCE_ENTRYPOINT": "<YOUR_VM_INSTANCE>",
        "VM_INSTANCE_TYPE": "<YOUR_VM_INSTANCE_TYPE>",
        "VM_INSTANCE_BEARER_TOKEN": "<YOUR_VM_BEARER_TOKEN>",
        "VM_INSTANCE_HEADERS": "<HEADER>=<HEADER_VALUE>,<HEADER>=<HEADER_VALUE>"
      }
    }
  }
}
See Windsurf MCP docs for more info.
Using Docker instead of binary
You can run VictoriaMetrics MCP server using Docker instead of local binary.
You should replace run command in configuration examples above in the following way:
{
  "mcpServers": {
    "victoriametrics": {
      "command": "docker",
        "args": [
          "run",
          "-i", "--rm",
          "-e", "VM_INSTANCE_ENTRYPOINT",
          "-e", "VM_INSTANCE_TYPE",
          "-e", "VM_INSTANCE_BEARER_TOKEN",
          "-e", "VM_INSTANCE_HEADERS",
          "ghcr.io/victoriametrics/mcp-victoriametrics",
        ],
      "env": {
        "VM_INSTANCE_ENTRYPOINT": "<YOUR_VM_INSTANCE>",
        "VM_INSTANCE_TYPE": "<YOUR_VM_INSTANCE_TYPE>",
        "VM_INSTANCE_BEARER_TOKEN": "<YOUR_VM_BEARER_TOKEN>",
        "VM_INSTANCE_HEADERS": "<HEADER>=<HEADER_VALUE>,<HEADER>=<HEADER_VALUE>"
      }
    }
  }
}
Usage
After installing and configuring the MCP server, you can start using it with your favorite MCP client.
You can start dialog with AI assistant from the phrase:
Use MCP VictoriaMetrics in the following answers
But it's not required, you can just start asking questions and the assistant will automatically use the tools and documentation to provide you with the best answers. Just take a look into Dialog example section for better understanding what you can do with it.
Toolset
MCP VictoriaMetrics provides numerous tools for interacting with your VictoriaMetrics instance.
Here's a list of common available tools:
| Tool | Description | Enabled by default |
|---|---|---|
query | Execute instant PromQL/MetricsQL queries | ✅ |
query_range | Execute range PromQL/MetricsQL queries over a time period | ✅ |
metrics | List available metrics | ✅ |
metrics_metadata | Stored metrics metadata (type, help and unit) | ✅ |
labels | List available label names | ✅ |
label_values | List values for a specific label | ✅ |
series | List available time series | ✅ |
export | Export raw time series data to JSON or CSV | ❌ |
rules | View alerting and recording rules | ✅ |
alerts | View current alerts (firing and pending) | ✅ |
flags | View non-default flags of the VictoriaMetrics instance | ❌ |
metric_statistics | Get metrics usage (in queries) statistics | ✅ |
active_queries | View currently executing queries | ✅ |
top_queries | View most frequent or slowest queries | ✅ |
tsdb_status | View TSDB cardinality statistics | ✅ |
tenants | List available tenants in multi-tenant cluster setup | ✅ |
documentation | Search in embedded VictoriaMetrics documentation | ✅ |
metric_relabel_debug | Debug Prometheus-compatible relabeling rules | ❌ |
downsampling_filters_debug | Debug downsampling configuration | ❌ |
retention_filters_debug | Debug retention filters configuration | ❌ |
prettify_query | Prettify and format PromQL/MetricsQL queries | ✅ |
explain_query | Parse PromQL/MetricsQL queries and explain how it works | ✅ |
test_rules | Unit-test alerting and recording rules using vmalert tool | ❌ |
Here are some additional tools that are available for VictoriaMetrics Cloud (with specifying VMC_API_KEY parameter) users:
| Tool | Description | Enabled by default |
|---|---|---|
deployments | List available deployments in VictoriaMetrics Cloud | ✅ |
cloud_providers | List available cloud providers in VictoriaMetrics Cloud | ✅ |
regions | List available cloud providers regions in VictoriaMetrics Cloud | ✅ |
tiers | List available deployment tiers in VictoriaMetrics Cloud | ✅ |
access_tokens | List available deployment access tokens in VictoriaMetrics Cloud | ✅ |
rule_filenames | List available alerting and recording rule filenames in VictoriaMetrics Cloud | ✅ |
rule_file | Content of a specific alerting or recording rule file in VictoriaMetrics Cloud | ✅ |
Prompts
The server includes pre-defined prompts for common tasks.
These are just examples at the moment, the prompt library will be added to in the future:
| Prompt | Description |
|---|---|
unused_metrics | Find metrics that are never queried and create relabel configs to stop ingesting them |
documentation | Search VictoriaMetrics documentation for specific topics |
rarely_used_metrics_with_high_cardinality | Identify high-cardinality metrics that are rarely queried |
Dialog example
This is just example of dialog with Assistant using MCP Server that can help to understand how it can work (but's it's real dialog with using the Victoria Metrics MCP server with Claude Desktop and configured to public playground instance):
-
You: What tenants are available in my VM?
-
Assistant In your VictoriaMetrics instance, the following tenants are available
0:0(default tenant),1:0,10:0,100:0 -
You: From now on, please use only default tenant
-
Assistant: I understand. From now on, I'll use only the default tenant (0:0) for all operations with your VictoriaMetrics instance.
-
You: Which metrics do we have?
-
Assistant: There are many metrics available in your VictoriaMetrics instance. The list includes metrics from various systems and components, such as:
- System metrics (
node_,machine_, etc.), - Kubernetes metrics (
kube_,container_,apiserver_, etc.), - VictoriaMetrics-specific metrics (
vm_,vmagent_,vmalert_, etc.), - Go runtime metrics (
go_), - Prometheus-related metrics (
scrape_,promhttp_), - Various application metrics (
argocd_,alertmanager_).
This is a comprehensive list of over 2000 metrics that are available for querying. Is there a specific type of metric you're interested in exploring further?
- System metrics (
-
You: Ok, let's work with kubernetes metrics from now on. Please show me which of these metrics never queried?
-
Assistant: Based on the results, I can see that there are two Kubernetes metrics that have never been queried (query count is 0):
kube_persistentvolumeclaim_deletion_timestamp- This metric provides information about when PersistentVolumeClaims were marked for deletion.kube_pod_init_container_status_last_terminated_reason- This metric shows the reason why init containers in pods were last terminated.
These metrics might be valuable for monitoring and troubleshooting purposes:
- The PVC deletion timestamp metric could help track deletion patterns or identify stuck PVCs.
- The init container termination reason metric could help identify common failure patterns in your initialization containers.
Would you like me to explain more about what these metrics track or suggest some useful queries to start monitoring them?
-
You: Yes, please. And also, can you create relabeling rules to stop ingesting these metrics?
-
Assistant: I'll create a relabel configuration to exclude these never-queried metrics from collection. This will help reduce storage and processing overhead. Here's the relabel configuration you can add to your VictoriaMetrics scrape configuration:
relabel_configs:
- action: drop
  source_labels: [__name__]
  regex: kube_persistentvolumeclaim_deletion_timestamp|kube_pod_init_container_status_last_terminated_reason
This configuration will:
- Look at each metric's name (the
__name__label) - Check if it matches either of the specified metrics
- Drop the metrics that match, preventing them from being collected and stored
You can add this to your VictoriaMetrics configuration file or to the relevant scrape job configurations in your Prometheus configuration if you're using Prometheus as a scraper for VictoriaMetrics. If you want to test this relabel configuration before implementing it, you can use the metric relabel debug tool to see how it would affect your metrics.
- Look at each metric's name (the
-
You: Yes, please debug this relabel config on real time series to see how it would affect my metrics
-
Assistant: Perfect! The relabel config works as expected:
- The first two test cases show that both
kube_persistentvolumeclaim_deletion_timestampandkube_pod_init_container_status_last_terminated_reasonmetrics are correctly dropped (resulting labels are empty{}). - The third test case confirms that other metrics like
kube_pod_status_phaseare preserved and not affected by our drop rule.
You can confidently add this relabel configuration to your VictoriaMetrics or Prometheus configuration to stop collecting these unused metrics. This will save storage space and reduce processing overhead without affecting your current monitoring capabilities.
- The first two test cases show that both
-
You: But i'm using vmagent resource of VictoriaMetrics operator, could you please give me part of specification for my agent with this relabel config?
-
Assistant: You're right, since you're using the VictoriaMetrics Operator and the VMAgent custom resource, the configuration needs to be in the appropriate format for that CR. Here's how you can add the relabel configuration to your VMAgent specification:
apiVersion: operator.victoriametrics.com/v1beta1
kind: VMAgent
metadata:
name: your-vmagent-name
spec:
  # ... your existing configuration ...

  # Add this section to configure global metric relabeling
  inlineRelabelConfig:
    - action: drop
      sourceLabels: ["__name__"]
      regex: kube_persistentvolumeclaim_deletion_timestamp|kube_pod_init_container_status_last_terminated_reason

  # ... rest of your configuration ...
Key points:
- In the VMAgent spec, you use
inlineRelabelConfigfor inline relabeling rules - The field is called
sourceLabels(notsource_labelsas in Prometheus config) - This is a global relabeling that will be applied to all metrics before they're stored
- In the VMAgent spec, you use
-
You: I decided not to remove those metrics, but just lower the sample rate for them using Downsampling. What downsampling parameters i have now?
-
Assistant: I can see that you currently have the following downsampling configuration:
-downsampling.period="7d:1m,30d:5m,180d:30m"This means:
- Data newer than 7 days is kept at its original resolution
- Data between 7-30 days old is downsampled to 1-minute resolution
- Data between 30-180 days old is downsampled to 5-minute resolution
- Data older than 180 days is downsampled to 30-minute resolution
Now, if you want to add specific downsampling rules for those rarely-queried metrics, you can use the downsampling filters debug tool to test how new rules would work. Let's test a configuration where we apply more aggressive downsampling to those specific metrics:
...getting series and using downsampling filter debugger...
Great! Now our test is working correctly. Based on the current configuration and our testing, here's a suggested downsampling configuration for your VMAgent CR that would apply more aggressive downsampling to those rarely-queried metrics:
apiVersion: operator.victoriametrics.com/v1beta1
kind: VMCluster
metadata:
  name: monitoring-vm-cluster
spec:
  # ... your existing configuration ...

  # Update the vmstorage section with the new downsampling parameters
  vmstorage:
    extraArgs:
      downsampling.period: '{__name__=\"kube_persistentvolumeclaim_deletion_timestamp\"}:1d:10m,{__name__=\"kube_pod_init_container_status_last_terminated_reason\"}:1d:10m,7d:1m,30d:5m,180d:30m'

  # ... rest of your configuration ...
This configuration:
- Applies 10-minute resolution downsampling for the rarely-queried metrics after just 1 day - Maintains your existing downsampling policy for all other metrics
The order of the downsampling rules is important - more specific rules should be listed first.
During this dialog, the assistant was using the following tools:
tenantsto get the list of available tenantsdocumentationto get information about functionality and data formatsmetricsto get the list of available metricsmetrics_staisticsto get the information about metrics usageseriesto get the time series for debuggingmetric_relabel_debugto debug relabeling rulesflagsto get the information about instance parametersdownsampling_filters_debugto debug downsampling configuration
But you can use any other tools and combine them in your own way.
Monitoring
In SSE and HTTP modes the MCP Server provides metrics in Prometheus format (see endpoints) and you can find in repo simple grafana dashboard for these metrics.
FAQ
Why is the MCP server using more resources than I would expect from a simple API proxy?
The server contains an embedded vector database with VictoriaMetrics documentation and blog posts for the documentation tool.
It helps to answer complex questions about VictoriaMetrics without providing all data to LLM.
This is the main source of resource usage. To reduce it, add documentation to MCP_DISABLED_TOOLS environment variable to completely disable the vector database loading.
How to use one MCP server instance for several VictoriaMetrics instances?
You can use MCP_PASSTHROUGH_HEADERS parameter in the MCP Server together with Header-based routing in vmauth to route MCP calls between instances based on HTTP header values from your MCP client config.
Roadmap
- Support "Prettify query" tool (done in
v0.0.5) - Support "Explain query" tool (done in
v0.0.6) - Support CI pipeline for building and pushing multiarch docker images (done in
v1.0.0) - Support tool for unit-testing of alerting and recording rules (done in
v0.0.7) - Support optional integration with VictoriaMetrics Cloud (via API keys) (done in
v0.0.9) - Add some extra knowledge to server in addition to current documentation tool:
- VictoriaMetrics blog posts (done in
v1.1.0) - CRD schemas
- VictoriaMetrics blog posts (done in
- Implement multitenant version of MCP (that will support several deployments)
- Add flags/configs validation tool
- Support tools for vmagent API
- Support new vmalert API
- Enabling/disabling tools via configuration (done in
v0.0.8) - Tools for Alertmanager APIs #6
- Support for metrics metadata in case of implementation in VictoriaMetrics
- Support authentication
- Add static index page with description and links to documentation
Mentions
Disclaimer
AI services and agents along with MCP servers like this cannot guarantee the accuracy, completeness and reliability of results. You should double check the results obtained with AI.
The quality of the MCP Server and its responses depends very much on the capabilities of your client and the quality of the model you are using.
Contributing
Contributions to the MCP VictoriaMetrics project are welcome!
Please feel free to submit issues, feature requests, or pull requests.